Log alerting
Log alerting allows you to set rules based on any log that is ingested either by an external log agent or the FusionReactor agent.
You can use this to alert on:
-
Events transpiring within your logs
-
Rates of change in log ingest
- Counts of logs that are of a specific type
- Values derived from log fields
Using LogQL you can set up alerts with a varying degree of complexity, by converting data within any ingested log into metrics.
Alerting dashboard
The alerting dashboard displays a summary of all your current alert groups and rules. Here you can see if any alerts are currently firing, when your rules were last checked and edit or delete rules.
You can filter for rules, groups or both using the search capability and also filter by state.

Alert rules
Alert rules are the individual checks that are made each time the group interval rotates. They are stored within groups, allowing for better organisation of your alerts and user defined intervals for rules to be checked.
You can have multiple rules within a group, all with their own subscriptions to dispatch alerts to various services such as Slack, Email, Pagerduty, Ops genie and Webhook.
Creating rules
To create a rule, click the plus icon within your desired group and the rule creation dialogue will open.
Each new rule consists of five steps:
- Setting the alert condition.
- Naming the rule.
- Selecting subscriptions for the rule to trigger.
- Configuring pending periods (optional).
- Adding a summary and run book (optional).
When complete, save your rule.
When the rule condition is evaluated and matches the condition you will then receive an alert to your configured subscription.
Step 1: Setting the alert condition
The alert condition is made of two parts:
-
The LogQL metric query.
-
The condition itself.
Your LogQL query for rules must return an integer, so you must ensure a metric query is used.
Metric queries in LogQL include functions such as rate, sum_over_time, avg_over_time and other similar queries. These queries can be used on a log range or an unwrapped log field.
Learn more
Note
Building alerts can become expensive. With multiple queries, each one of these queries has to run and this can take some time and have an impact on the overhead.
Tip
If you are running complex expensive queries try not to run them too often.
The condition of a rule can be configured to be greater, less than or equal to your specified value.
A graphical representation of your query values and threshold values is displayed to the right of the condition:
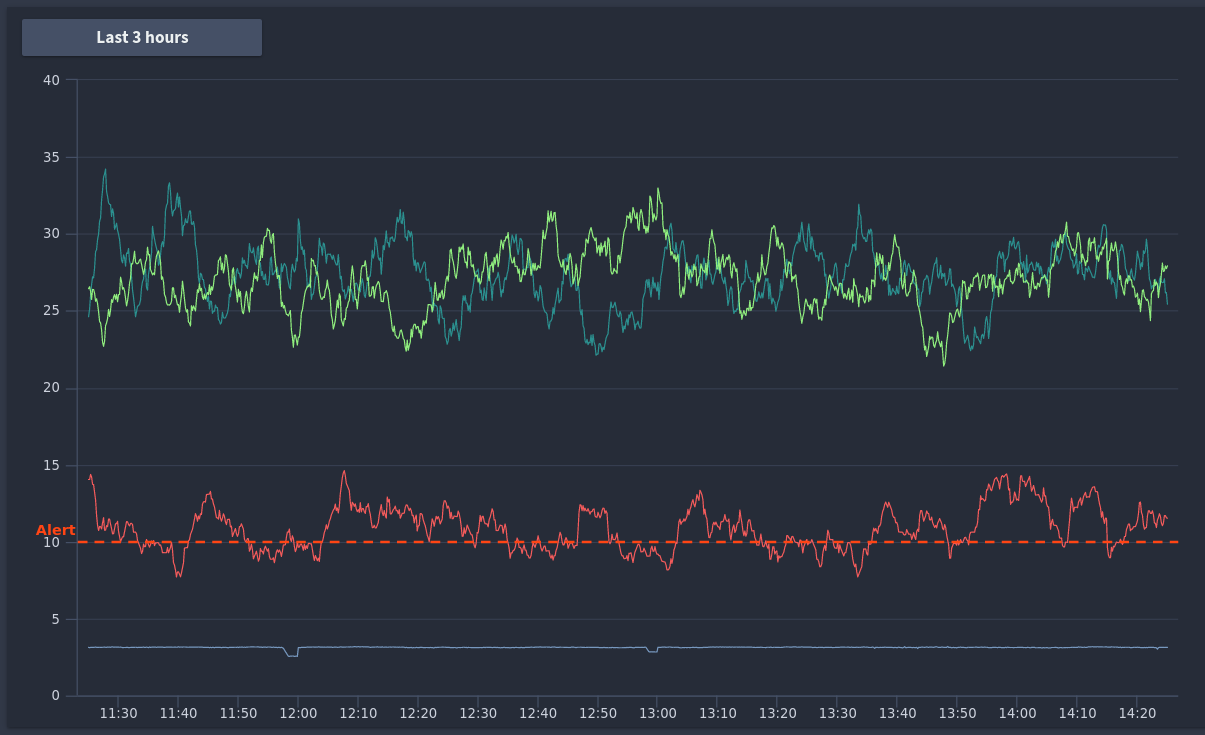
Here you can see at what point your alert would fire, and adjust the time period of your graph up to the last two weeks of data.
Step 2: Naming the rule
The rule name will be used in your received alert, so should be something identifiable that you can action.
Step 3: Selecting subscriptions for the rule to trigger
Subscriptions are the targets your alerts will be dispatched to. Supported integrations include Slack, email, Pagerduty, OpsGenie and HTTP Webhooks.
You can either use existing subscriptions or configure new subscriptions for your rules to trigger.
Subscriptions used for the current metric based alerting and cloud alerting are shared, so any subscription you use for metric alerting will already be usable in the rule creation screen.
Tip
You can also create new subscriptions by clicking Configure Subscription under the dropdown.
Step 4: Configuring pending periods (optional)
A pending period is the minimum duration for which a rule should exceed its threshold.
Time formats for the threshold are identical to what you would use to define your LogQL ranges, so 1m, 5m, 1h, 1d, 1w...
You can use ranges if you want to ensure a threshold is exceeded for an extended period of time, for example you may want to know if a single IP address is hitting your application for at least 5 minutes, as opposed to for only a few seconds.
Step 5: Adding a summary and run book (optional)
Summaries and run books can be added to an alert context, this will give your alerts additional context and allow you to link an external resource for troubleshooting this particular alert.
An example of this would be a run book attached to a server crash alert that documents how to ensure your system has fully recovered.
Example rules
Here are some example alert types you could configure based on your log data.
Event alerts
An event based alert is designed to fire when a specific log line is sent to the cloud, for example a specific exception firing or a specific sequence of logs that indicate a potential issue.
Alert that occurs when a server encounters an OutOfMemory exception and subsequently crashes
Example
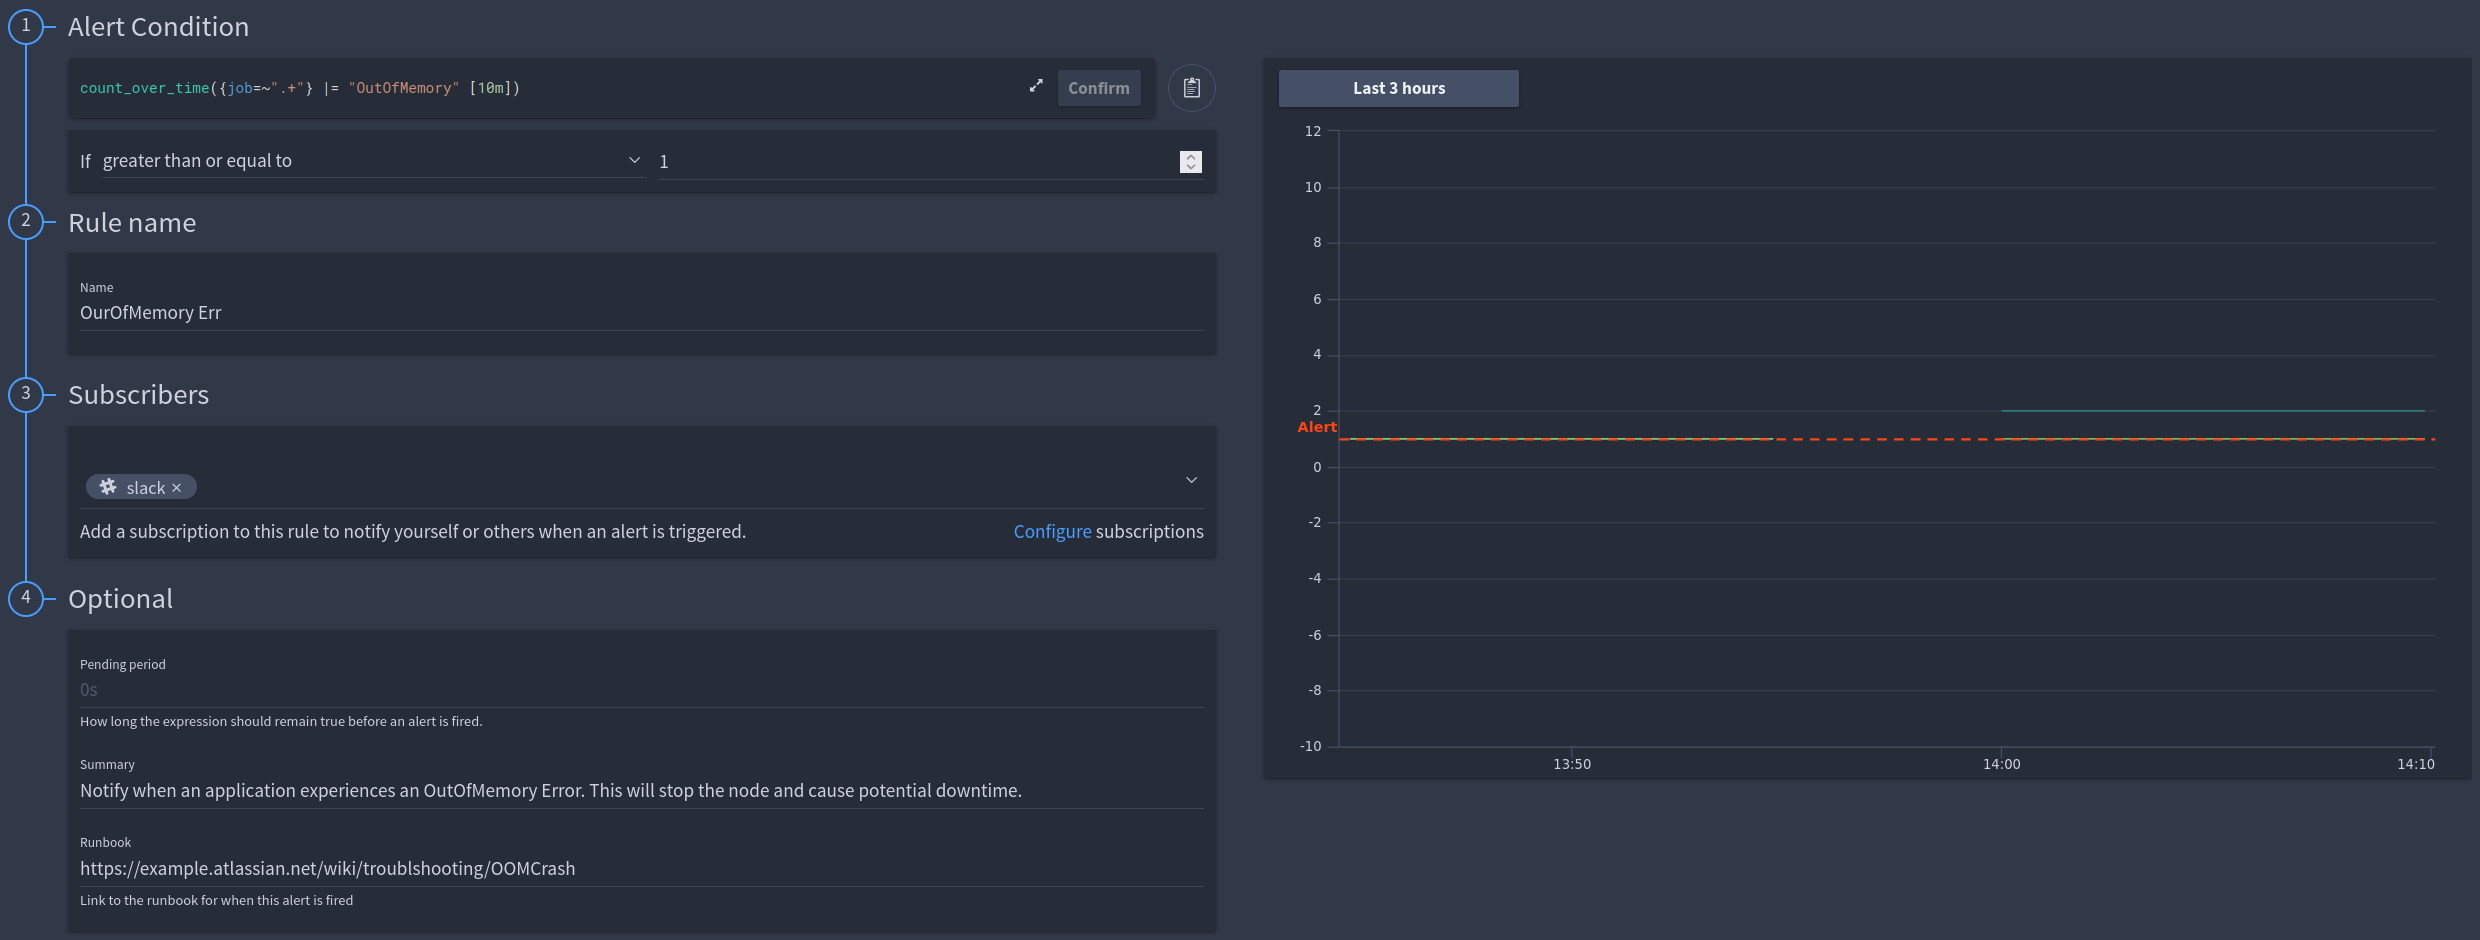 LogQL Query:
 count_over_time({job=~".+"} |= "OutOfMemory" [10m])
Rate alerts
A rate based alert takes advantage of the rate function within LogQL, this allows you to generate an alert abased on the rate of change for a value, as opposed to the value itself.
Using a rate query to detect and alert based on a log flood
Example
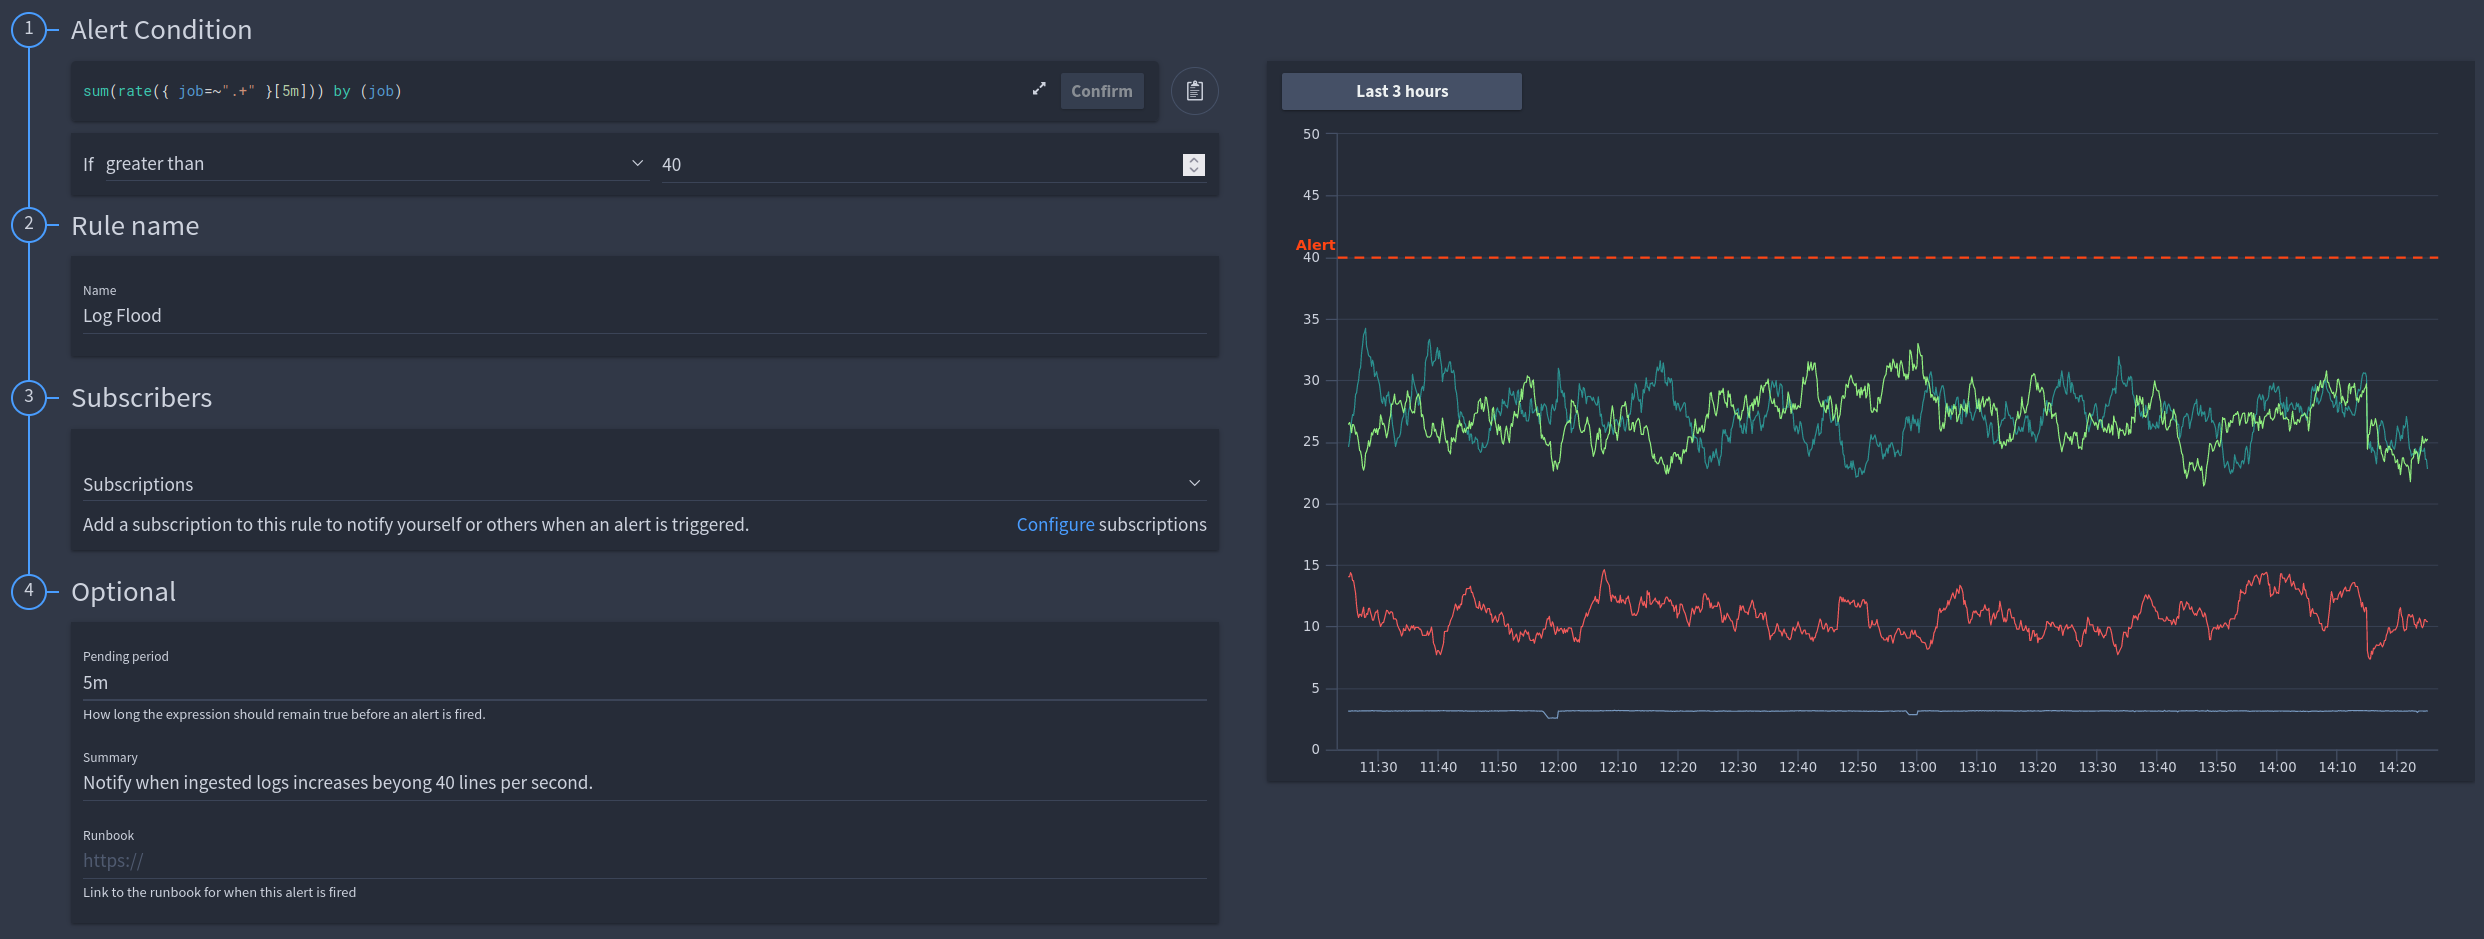 LogQL Query:
 sum(rate({ job=~".+" }[5m])) by (job)
Info
This is using a pending period to avoid the alert firing for only a temporary spike in logs that could be triggered by a redeployment or some other event.
Range value based alerts
Range based alerts utilize the count of log lines within a defined period using a specific label or filter.
Combining the data of two range queries to create a percentage value of errors within my ingested logs
Example
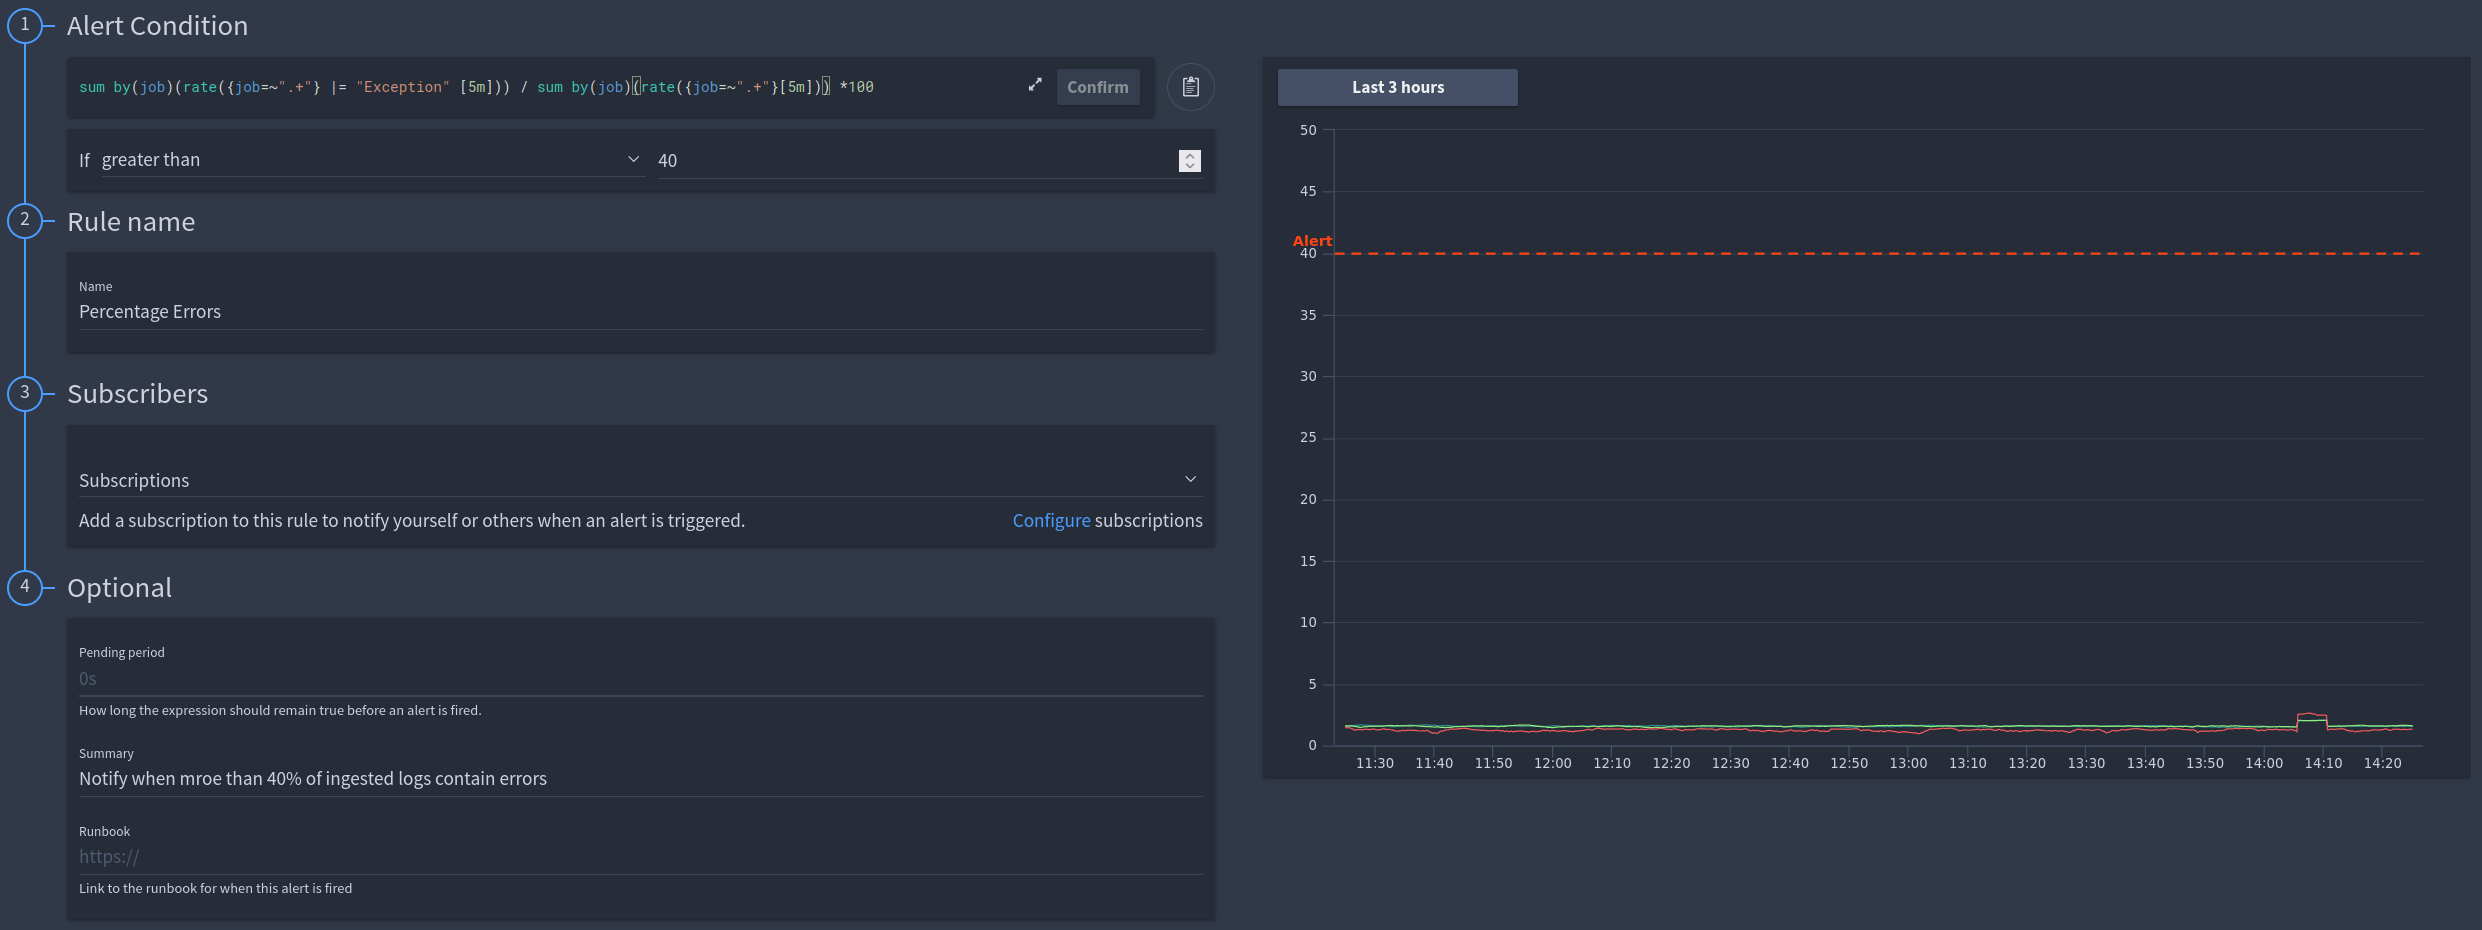 LogQL Query:
 sum by(job)(rate({job=~".+"} |= "Exception" [5m])) / sum by(job)(rate({job=~".+"}[5m])) *100
Info
In this example we are manipulating the results of two separate queries into an alertable value.
Unwrapped value based alerts
Unlike range based queries that use the log lines and labels to generate an integer value, unwrapped value queries use the value of log fields themselves.
Extracting the CPU time from the request log in FusionReactor and summing this by URL. This will result in a CPU time per page metric, allowing us see which pages consume the most server resource
Example
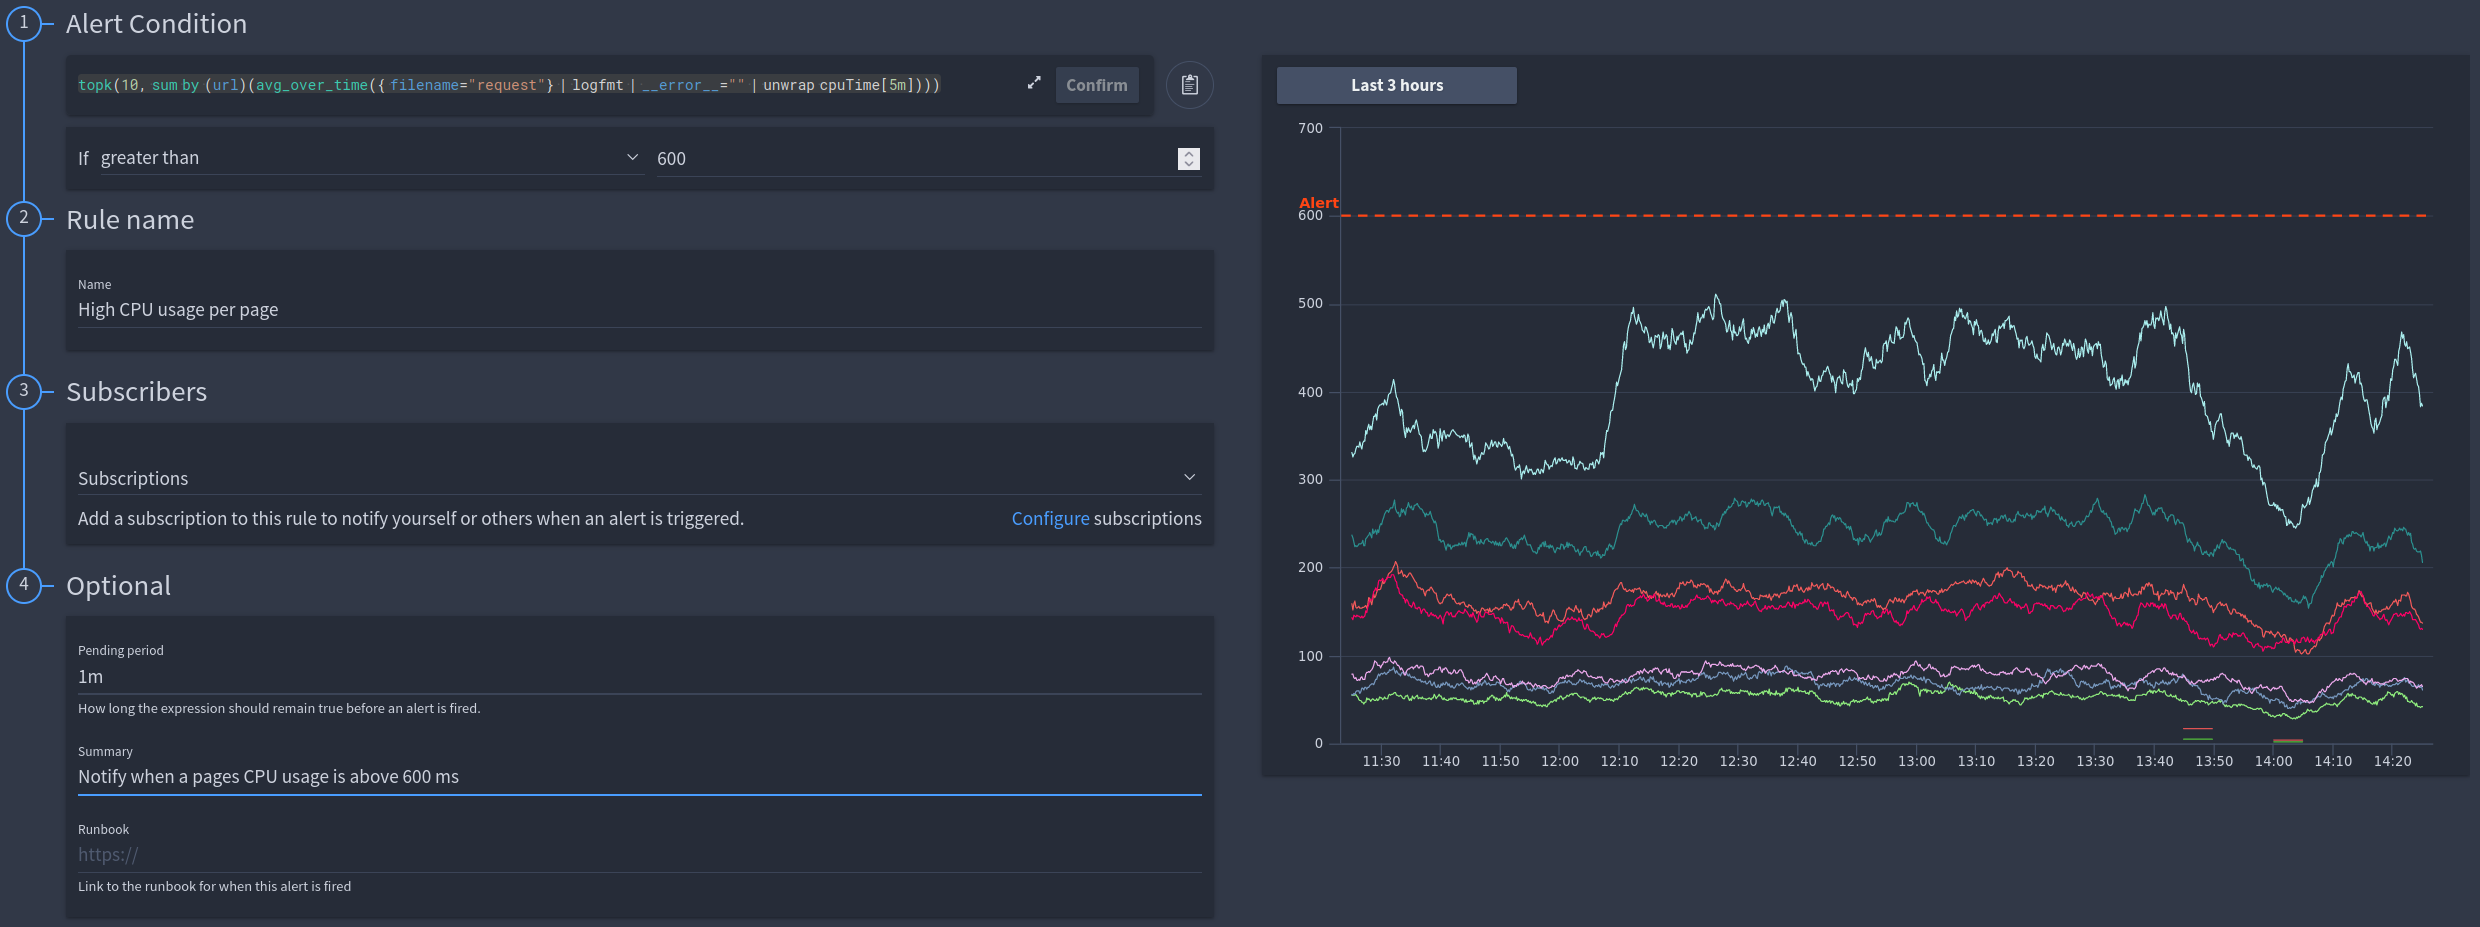 LogQL Example:
 topk(10, sum by (url)(avg_over_time({ filename="request"} | logfmt | __error__="" | unwrap cpuTime[5m])))
Info
This example uses field values within the request log, however it will work with any log field or log file.
Groups
For some rules where you require immediate action you can set an alert interval for one minute, but for rules where you are analyzing data for a longer period of time you may only need to check once an hour or even once a day.
Before creating alert rules, you are required to create at least one group, which you can do by clicking Create group. Example groups could be:
| Name | Interval |
|---|---|
| Immediate alert | 1m |
| Production | 5m |
| Hourly checks | 1h |
| Daily checks | 1d |
Need more help?
Contact support in the chat bubble and let us know how we can assist.