Debug Example : Setting a conditional breakpoint in ColdFusion loop
This example will show how to set a conditional breakpoint in a ColdFusion loop using the FusionReactor Production Debugger.
The Code
```cfm tab="pdloop.cfm"
## Setting a conditional breakpoint

In this example, we are going to set a breakpoint when a condition has
been met within the `aArray` variable.   The condition which we would
like to set the breakpoint is when:

```cfm
aArray[i] EQ "March"
Setting this in the New Breakpoint would be as follows:

Note
For Lucee and Railo servers please use just the filename (e.g. pdloop.cfm)
| Production Debugger Field | Value | Meaning |
|---|---|---|
| Breakpoint Trigger Location | Source File/Line Number | We are selecting to set a breakpoint within a specific source file and a specific line number. |
| Source Code Filename | pdloop.cfm | Name / location of the file where the code is stored (this can be the filename only or the full path. For ColdFusion servers, this depends on how the file was compiled). |
| Source Line Number | 3 | This is important. If we are checking the value of a variable, then this variable must have been set before this line number has been reached in order for the breakpoint to fire. |
| "Trigger On" Condition | aArray[i] EQ "March" |
This is the example condition which will cause the breakpoint to fire and execution of the page to halt. |
| Trigger Fire Count | Always | This indicates that the breakpoint will always fire. If we set the Fire Count to a numeric value, e.g. 3 - then the breakpoint would fire 3 times. |
| Breakpoint Trigger Action | Enable Interactive Debugger - Pause Thread | Will tell FusionReactor to pause the currently executing thread when the condition has been met |
| Thread Pause Time (in seconds) | 60 | The thread will be paused for 60 seconds. During this time, the breakpoint can be intercepted by clicking on the Production Debugger icon: Alternatively, it can be viewed from within the paused threads section of the Debugger menu item. |
| Thread Pause Execution | On every thread that fires the breakpoint | Will cause the engine to halt for every single thread in which the breakpoint condition fires. |
When the breakpoint has been set up, you will see the following in the breakpoints section when you click on the Debugger menu item.
If the page has not yet been executed (the case with our example), or if there is another problem with the breakpoint - then we will see the state as below.

A broken red square breakpoint icon indicates an issue of some kind:
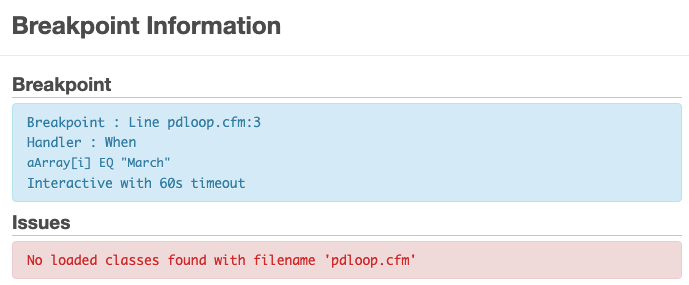
To view the breakpoint information, including any potential problems with the breakpoint, we can click the info icon to the right of the breakpoint name.
This will show the following window:

In this case there are no loaded classes found with the matching file name, as we have not yet executed the page.
Seeing when a breakpoint fires
When the page pdloop.cfm is executed, the condition will fire and
the page will halt execution.
When the breakpoints section in the Debugger is reloaded (this is automatic every 60 seconds, or can be reloaded manually by refreshing the page), the breakpoint will be shown as follows:

Note that the icon is now solid, indicating a valid breakpoint.

We now have information about where this breakpoint is installed, and you can see that the State is Enabled and Installed.
When the breakpoint fires, then the Debugger icon will appear in the top
banner: 
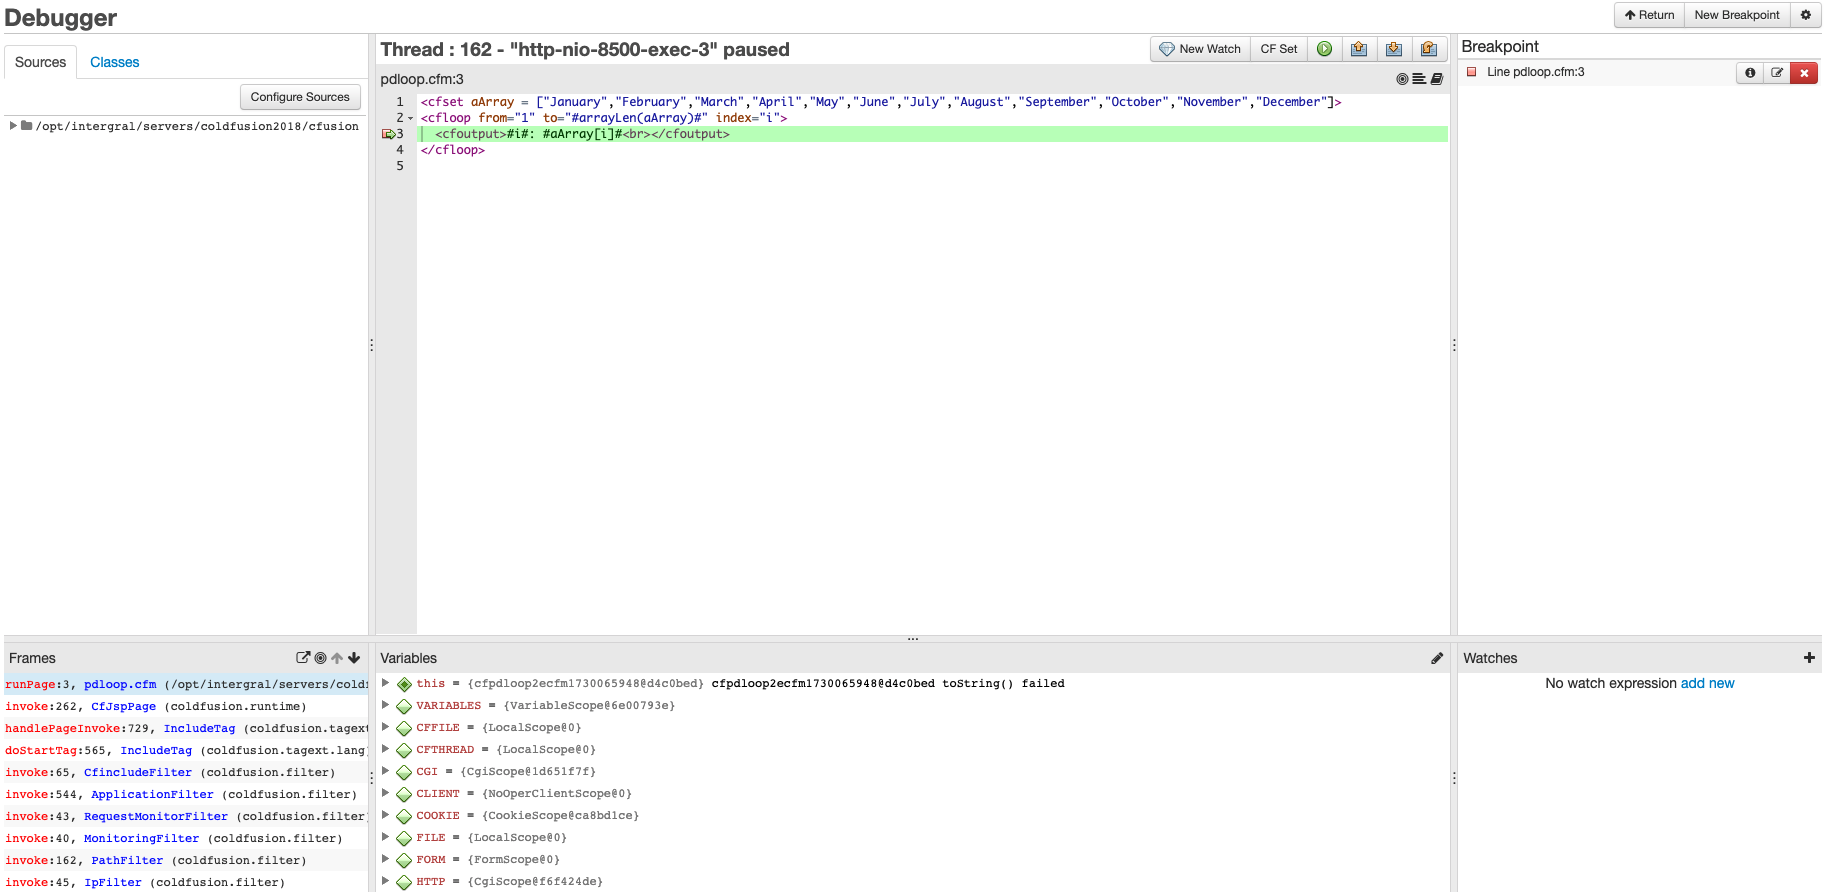
You can either click on the Debugger icon in the top menu to jump straight into the debug view for the paused thread, or you can click the Debugger link in the Debug Menu: you will then see the paused thread in the bottom section - together with the Timeout Countdown

To start the Production Debugger session, you need to click on the
Debug Icon for the thread - the leftmost button in the following
image: 
Working with the a debugger in the Thread View Page
The Thread View in the Debugger shows the details of a specific thread once the thread has been paused in the interactive debugger.

Source Code Viewer
The source code viewer will show the source code for the location where the interactive debugger is currently paused - line 3 in our example.

The variables viewer shows the variables currently available on the thread at the specific location that the interactive debugger has paused.

As we have set the breakpoint to fire when aArray[i] EQ "March" - we
would expect
1 | |
We can also see the Variable values in the aArray variable

Note that the array index starts at 0, not 1
Modifying a variable value
We can now modify the value of a variable. In this example, let us
change the value of "May" to "May in the Spring"
You should always use the CF Set button to set a CF variable  -
Strings need to be in quotes - numerical values, simply a number

You should now see the following when you expand

Once you have changed the variable value, hit the Resume icon  to continue execution of the program.
The page results will then look like.
1 2 3 4 5 6 7 8 9 10 11 12 | |
Note
if you instead receive an error that 'The request has exceeded
the allowable time limit Tag: cfoutput', try adding <cfsetting requesttimeout="3600"> to
the top of the page. This will increase the page timeout to 60 minutes,
allowing the program to stay paused by FusionReactor for much longer
before resulting in a timeout once resumed. You will also need to modify
the breakpoint to fire on line 4 with this extra line at the top of the
file.